Help Centre / Reports & GST/BAS / Understanding your Reports dashboard
Understanding your Reports dashboard
What the Reports overview shows and how the date range and comparison work on each plan.
Reports turns your quotes, invoices, payments, expenses and time into a live picture of the business. It reads straight from your records, so there is nothing to set up — the numbers update as you work.
- Open More → Reports. On desktop, Reports also sits in the left sidebar.
- Use the Overview, Financial and Customers tabs to move between the money picture, profit and cashflow, and who your work is coming from.
- Tap a report in the report library (Sales, Payments, Expenses, Customer ageing, Profit & Loss, GST) to open the full breakdown.
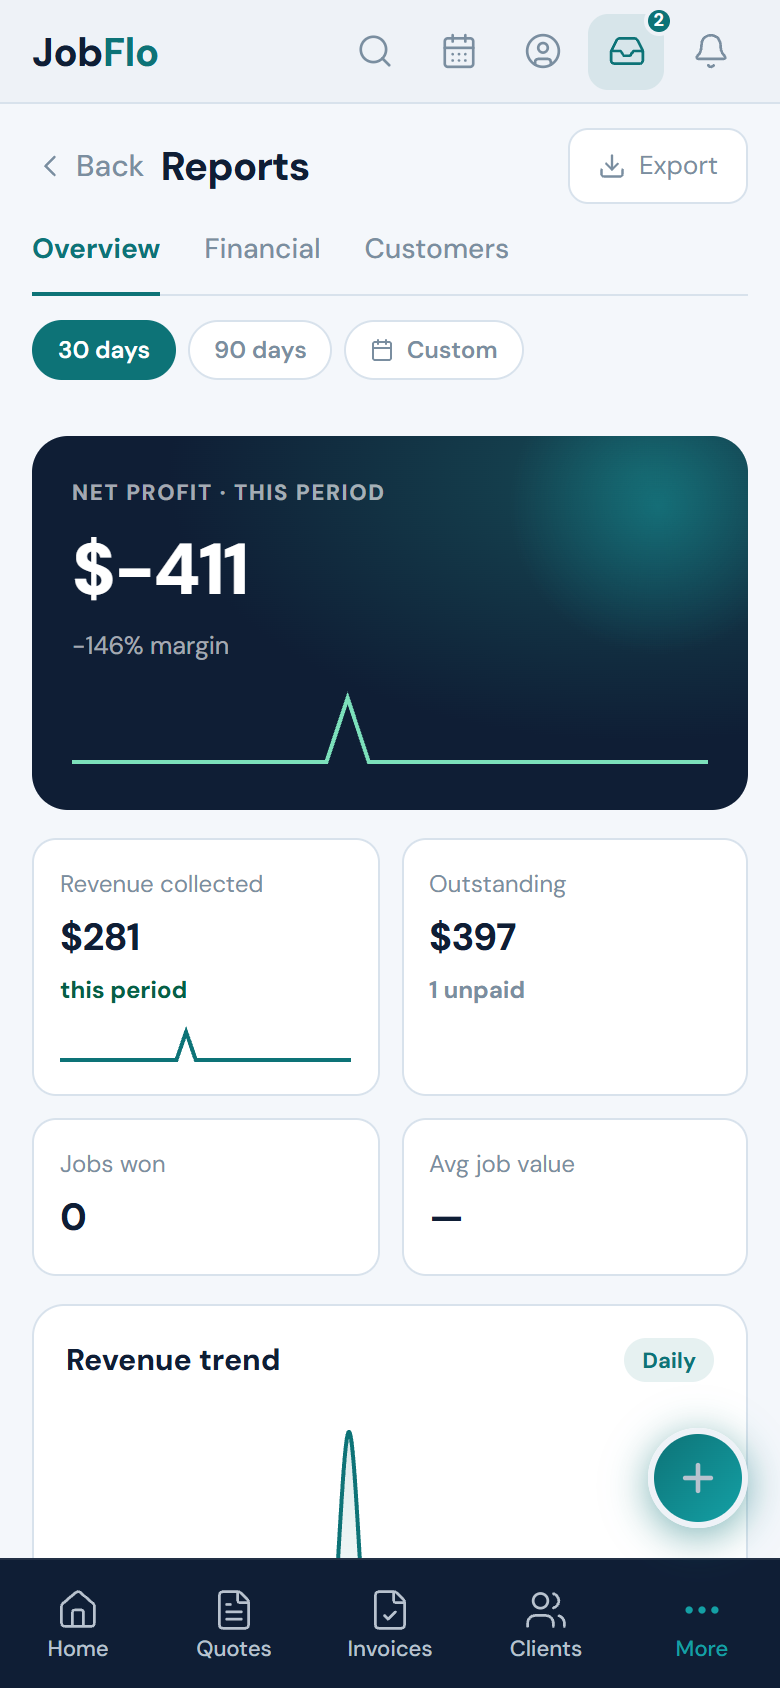
Choosing a date range
On Starter, reports always show the current calendar month. On Pro and Business you can pick any date range from the range picker at the top — a month, a quarter, a financial year, or a custom span.
On Business, each headline figure also shows the change against the previous period of the same length, so you can see whether revenue and profit are up or down at a glance.
Reports are visible to the owner and to any team member with the "See Reports" permission. If a staff member cannot see Reports, turn that permission on from More → Team.
Revenue figures on the dashboard are money actually collected in the period, not the total you have invoiced. The Sales report shows what you have invoiced; the Payments report shows what has come in.
Was this article helpful?
Related articles
Still stuck? Contact JobFlo